Deckhand
15 min read
An electronic logbook that allows fishermen to report catch, trip activities, and location data to the New Zealand government.

The project was divided into two products Deckhand and Right time, Right Place dashboards. In this case study we focus on Deckhand with its usability improvements and onboarding.
Initial Problems
01
High support call volumes
The reporting process was so complex that new users relied entirely on customer support to complete their tasks.
Increase in operational costs
The troubleshooting calls were long and frequent forcing the business to scale their headcount for support team.
Goal
02
Solution
03
Index
04
What frictions and confusions arise from the current Deckhand workflow?
What are the most common and time-consuming reasons for users to call customer service?
What are the use-cases and mental models of the users, and how do these conflict with the current design of the app?
Which information or tools would help users to support themselves better?
Understanding the system
02
Data flow

Secondary research
03
Desk research
We focused on common breakdown points across reporting workflows, including report generation, submission and error handling.
Product teardown
In the process of analysing Deckhand, we found that many usability issues were related to the product's context.

The data in the dropdown menu is covered by the keyboard making it hard to scroll.

The icons are unlabelled making it hard to interpret their action.

After completing a fishing report, users are returned to first step which is selecting the fishing method to log the next fishing set. Without a confirmation screen, this causes confusion, users expect to move forward to the next step rather than restart the flow.
Primary research
04
To validate our assumptions we conducted Interviews and Usability tests with the original product.
Interviews
Users
3 Customer support members
Type
Goal
To understand the recurring issues using support tickets.
Users
7 Fishermen
Type
Goal
To understand the real world usage of Deckhand under environmental limitations.
Sample questions (Fishermen)
How often do you receive calls from customers?
At what times of day do they usually call?
What are the top three issues they raise regarding the Deckhand app?
Sample questions (Support team)
Can you describe how you use Deckhand during a typical fishing trip, from starting the trip to submitting your catch?
Have you ever made mistakes or felt unsure while entering data? What caused that?
Current state usability testing
Users
4 Dragonfly employees
Type
Goal
Key findings
Finding 1
The reports on the side bar is hard to understand as it doesn’t indicate the progress of the fishing event.
A2, A14, A15, B12, B22, B27, B28
Finding 2
The end trip button is buried under a menu and its not easily accessible.
A4, B22, D4
Finding 5
Support agents needed system details (iPad version, OS, Deckhand version) before troubleshooting. Manually retrieving this scattered info was difficult for non-technical fishermen, wasting critical support time.
A1, A13, A15, B30, D3
Finding 3
When the keyboard is active, it hides the data input fields, obscuring important information from view.
B30, B31, D2
Key insights from interview and usability test
Fishers struggled with hidden gestures, unclear user flows and unlabelled icons resulting in steep learning curve and limited error recovery methods when stuck.
Insight 1
Fishermen often felt confused and hesitant while using deckhand due to unclear terminology, hidden gestures, and unhelpful error messages making it difficult for them to understand what was happening on the screen. Thus creating frustration and increased their dependence on customer support.
F4-s, F9-s, F4-f, F8-f, F8-s, F13-s, F5-f, F10-f, F2-t, F3-t
Insight 8
Due to lack of an onboarding process, the older fishermen found it difficult to transition from paper to e-logbooks, finding their own means of coping with the transition also causing a huge learning curve.
F7-f, F8-f
Insight 4
Fishermen found the interface visually difficult to use because the interface relied heavily on unlabelled icons for identification and low contrast elements, which made it harder for them to communicate these icons with the support team.
F11-s, F8-f, F16-s, F10-f, F5-f, F8-t
Insight 7
Some of the common problems fishermen encountered where internet, Bluetooth connectivity failures, Logbook renewal errors and accidental creation of additional reports. This shows that there is a need to communicate these errors clearly within the product.
F21-s, F6-f
*The alphabets and numbers indicates individual findings from users which helps to track exactly where the insight comes from.
Designing concepts
01
Low-fi concepts
This prototype focused on improving the display and interface of the workflow, as well as clarifying key operations.
Problems that needed to be addressed
Users need to clearly understand which stage they are currently in within the overall workflow
Users need to easily distinguish between different report types.
Users need to understand the purpose and meaning of the timer displayed in the report section
Users need to be able to clearly differentiate between interactive elements such as dropdowns, labels, and buttons
Feature solutions

System info
Grouped all device diagnostics in one place, eliminating the need to manually search during support calls.

Offline troubleshooting
Fishermen can troubleshoot independently, even when stranded at sea with no network connection.


Quick selections
Addition of 'recently used' section and 'saved addresses' to remove the friction of repetitive manual data entry
Challenges
Design decisions
02
Comparative usability testing
Concept 1

Using a circular timer with a countdown to show the time left to submit the report

Providing a quick selection tab along with a scrollable list of all the fishing methods and species

Exploring different ways to show the report status card as well as guiding users on when to take an action.
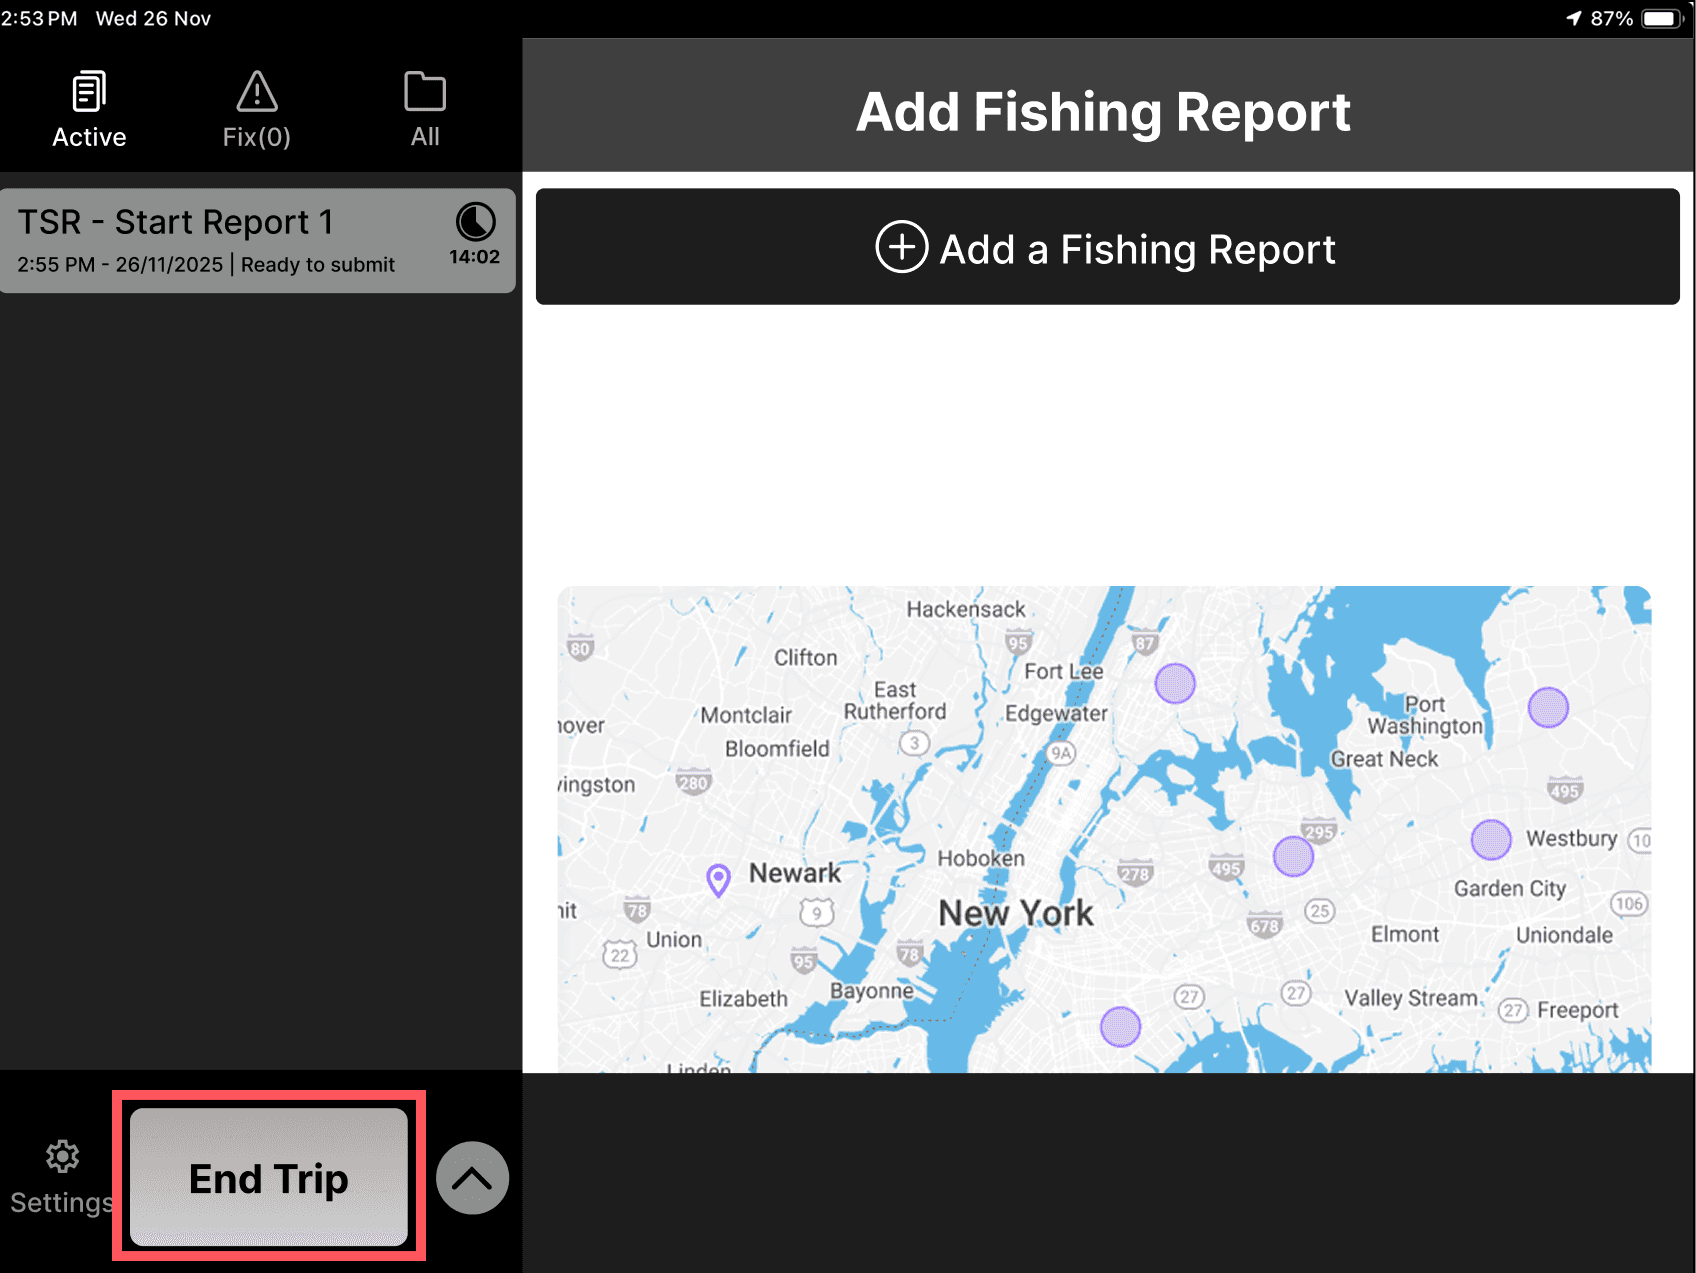
Exploring the placement of End Trip button
Concept 2

The in progress reports are highlighted with an active status along with a timer

On click the recently used options are shown as part of the entry point for fishing.
Concept 3

1
The entire report status is redesigned to have pending, In progress and completed tabs.
2
The card is minimised when not in active state.
3
The report card has been designed to show a timer, submission status and key action buttons.

1
Adding a collapsable side bar so fishermen have more real estate space on smaller iPads.
2
The report section can be minimised when not in active state.

This version also has success screens and reconfirmation of actions so errors can be prevented.
New challenges
03
Context for onboarding
Goal

1
Adding a collapsable side bar so fishermen have more real estate space on smaller iPads.
2
This section would consist of a step by step video which shows someone completing the report.
3
Users can get the context of which part of the flow the video is connected to.
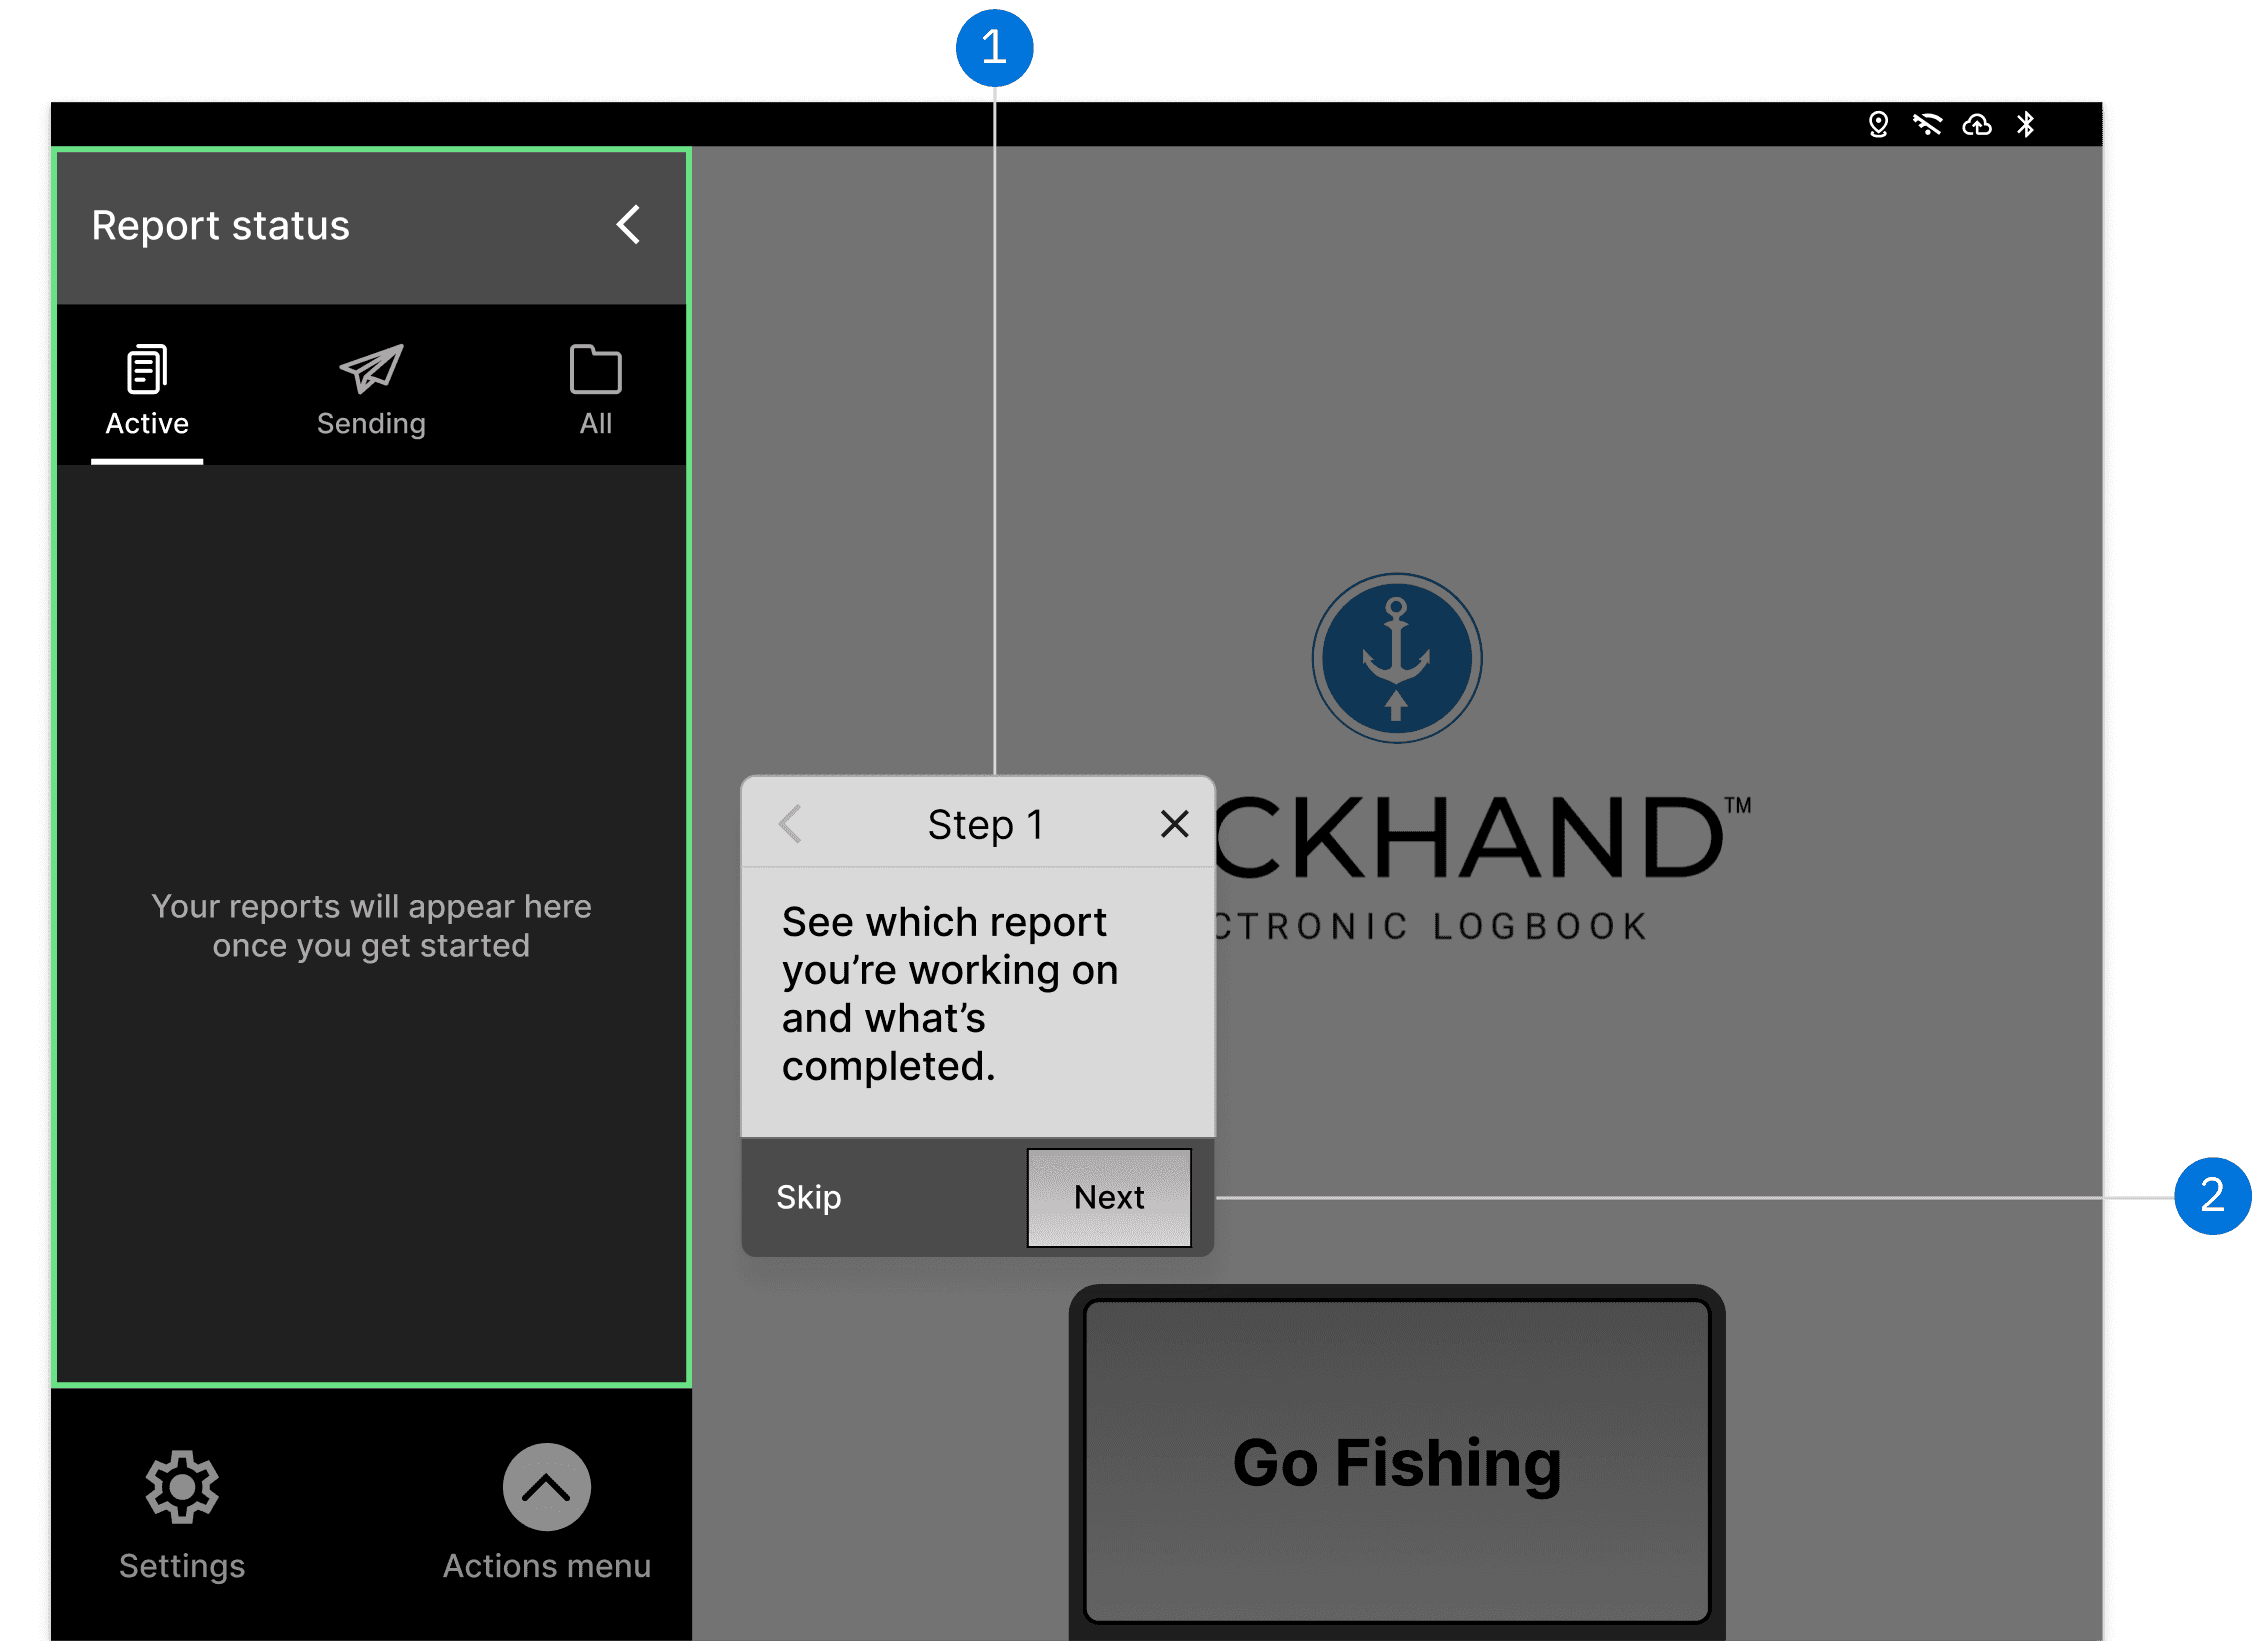
1
We guide users on where they could find different elements on the UI.
2
At every point we provide users with a choose slowly gaining trust.
Proposed solution
04
Final designs
Before
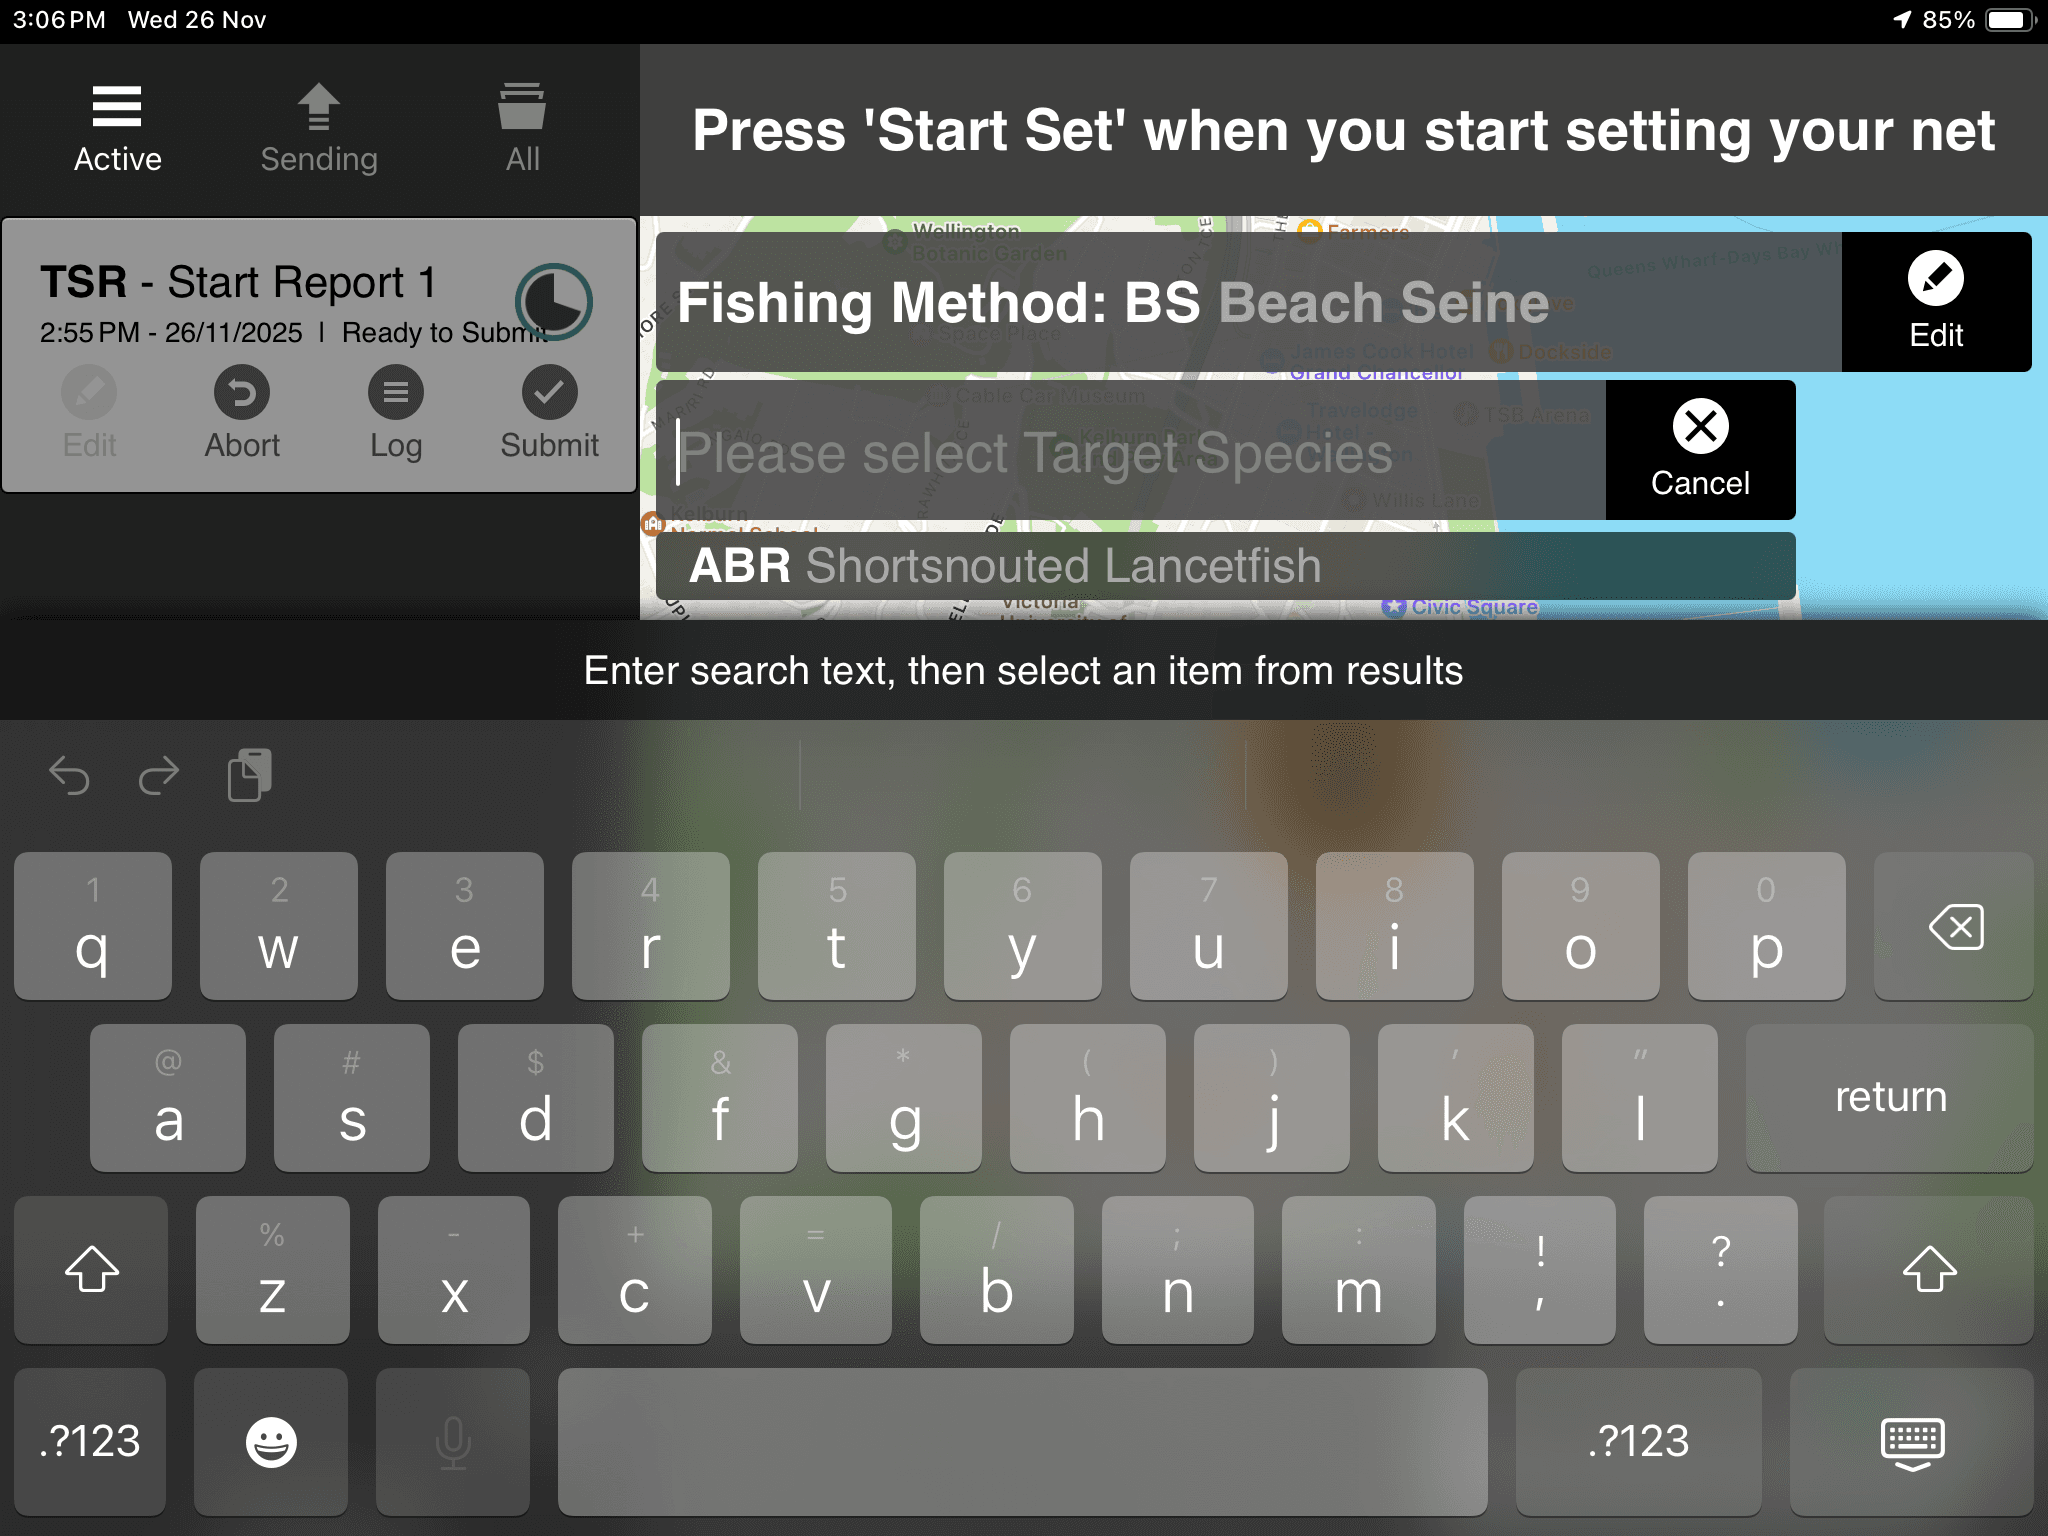
The report section on the left doesn't provide any context to what it currently shows.
With keyboard being a major part of the UI it provides only two selection items at a time.
After
The entire report section is redesigned to provide more clarity with new status indicators and countdown timer.
Improved data entry by hiding the keyboard on scroll to reveal more dropdown options.
Before

After

Before

After

More changes:
Learnings
05
Trade-offs
Next steps


Next Project
Right Time, Right Place
Data driven dashboards for fishers.